by Conglin Xu, OGJ, June 12, 2013
The US recorded the largest single-year increase in oil production in 2012, according to the BP Statistical Review of World Energy. The review, released June 12 [2013], was the company’s 62nd annual report.
Backed by increasing production of unconventional oil and gas, the US recorded the highest growth in both oil and natural gas output in 2012, BP said. Meanwhile, coal consumption in the US experienced the largest decline in 2012 as it was displaced by less-expensive natural gas in electric power generation.
According to BP, world nuclear output recorded the largest annual decline in 2012. After 2011’s Fukushima accident, “higher imports of fossil fuels including [LNG] kept the lights on” in Japan. Due to higher natural gas prices in Europe, power generators substituted coal for gas—an opposite course from the US. [...]
World [primary - D.R.] energy consumption also dropped to 1.8% in 2012, down from 2.4% the previous year, BP reported. The decline was attributable to the economic slowdown as well as improved energy consumption efficiency due to high prices. As the major source of demand growth, emerging countries accounted for 56% of global consumption, up from 42% just 20 years ago.
Global oil consumption increased by 890,000 b/d, 0.9% below the historical average. OECD consumption declined by 1.3% (530,000 b/d) and non-OECD consumption grew by 3.3% (1.4 million b/d).
Global oil production climbed by 1.9 million b/d. Despite a decline in Iranian output due to international sanctions, OPEC contributed to about three quarters of the global increase. [Libyan production recovered strongly after the sharp drop in output in 2011, and Saudi Arabia, the UAE, and Qatar all produced at record levels - D.R.]. Non-OPEC production grew by 490,000 b/d [revised figure 440,000 b/d, according to BP data - D.R.] with increases in the US, Canada, Russia, and China.
BP’s review also stated that world natural gas consumption grew by 2.2%, below the historical average of 2.7%. [Read more]
(Please see BP Statistical Review of World Energy June 2013 - D.R.)
Showing posts with label Coal. Show all posts
Showing posts with label Coal. Show all posts
Wednesday, June 19, 2013

Wednesday, December 28, 2011
Platts Top 250 Global Energy Company Rankings 2011
Platts, Nov 2, 2011
The Platts Top 250 recognizes outstanding financial performance for the previous fiscal year. Each company listed in the Platts Top 250 has distinguished itself through its remarkable performance and the outstanding efforts and dedication of its team. [...]
Top Ten
The Platts Top 250 recognizes outstanding financial performance for the previous fiscal year. Each company listed in the Platts Top 250 has distinguished itself through its remarkable performance and the outstanding efforts and dedication of its team. [...]
Top Ten
The entry of German multi-utility E.ON AG to the top ten in 2009— the only non-Integrated Oil and Gas (IOG) company to do so in the last five years—proved fleeting [please see remarks below -- D.R.]. The oil and gas giants reasserted their dominance of the top ten rankings, taking all ten spots despite a stricken BP dropping far from sight. On the back of higher oil prices, the top ten companies brought in a combined $178.874 billion in profits, a 20.4% increase from 2009, but still down from the bumper year of 2008, when profits hit an all-time high of $214.042 billion.
US giant Exxon Mobil Corp retained the top spot in 2010, while Chevron Corp moved up from ninth in 2009 to second place as it boosted its return on invested capital (ROIC) to 16% from 10.2% in the previous year. Gazprom OAO, PetroChina Co Ltd, Total SA and the China Petroleum & Chemical Corp took third, fourth, fifth and eighth places, respectively, while Royal Dutch Shell climbed from tenth to sixth.
Three re-entrants to the top ten in 2010 included ConocoPhillips—now the subject of an innovative demerger into upstream and downstream businesses— which moved up from 24th place to seventh. Meanwhile Russia’s OJSC Rosneft Oil Company and Lukoil Oil Company rose from 14th and 11th places, respectively to take the ninth and tenth spots.
E.ON dropped back to 13th from sixth, and Brazil’s Petrobras-Petroleo Brasilier fell from fourth in 2009 to 12th in 2010. But the biggest omission from the top ten was UK major BP. Ranked second in 2009, BP dropped to 118th on account of the cost of the Macondo oil spill in the US Gulf of Mexico. Although in dollar terms its asset base expanded, as did its revenues, BP’s profits were wiped out. The company posted a loss for 2010 of $3.719 billion.
Here Come the Russians
Here Come the Russians
Although the year-to-year changes in the top ten companies can be small, the big trends can be seen from longerterm comparisons. In 2006, the top ten consisted of five west European integrated oil and gas companies, three US majors, PetroChina and Petrobras. In 2010, there were still three US majors but now two Chinese and three Russian companies, with only two European companies remaining. [...]
The entry of Russian companies into the ranks of the world’s top energy enterprises is a striking feature of the 2010 list, and features not only oil and gas, but also electricity industry companies as a result of privatization in the sector. Of the top ten fastest-growing companies, three are Russian: RusHydro JSC, Bashneft OJSC and Moscow United Electric Grid OJSC, with RusHydro recording a giant three-year CGR of 106.1%. There are now 15 Russian companies in the top 250, compared with 11 in 2009 and nine in 2006.
Mighty Gazprom’s position remains pre-eminent in natural gas, based on its huge production volumes and monopoly grip on Russia’s gas pipelines and exports. However, it may one day have a challenger in the form of private gas company Novatek OAO, which is operator of the planned Yamal LNG project. Novatek has moved up from 126th position in 2009 to 104th in 2010. Profits rose from $854 million to $1,358 million with an impressive ROIC of 19% in 2010—the twelfth-highest ROIC out of the entire top 250. It is also the 34th fastest-growing company based on its three-year CGR. Including AK Transneft OAO, the country’s oil pipeline monopoly, Russia now has eight companies primarily focused on oil in the top 250 as well as two gas and five power sector companies. [...]
Asian Leaders
The number of Asian companies in the top 250 continues to rise, reaching 70 in 2010, up from 67 in 2009 and 56 in 2006. In addition, despite having more companies represented, the average ranking of Asian companies has also improved from 135.2 in 2006 to 134.9 in 2009 and 131.3 in 2010 (a lower number denotes a higher ranking). Asian companies are not just increasing in number, but are increasing their rankings relative to their international peers.
Within Asia, the average ranking of Japanese companies overall has improved from 145.9 to 132.1. This partly reflects the Japan Petroleum Exploration company dropping out of the top 250, but the improvement is notable given the sharp fall in the ranking of the Tokyo Electric Power Co (Tepco) which was ranked 54th in 2009, but 131st in 2010.
This is the result of the financial impact of the Fukushima nuclear disaster in March 2011 and Japanese reporting of financial data based on fiscal years running from April-March. Tepco recorded a loss of $14,881 billion in fiscal 2010. Other Japanese companies dropping down the rankings include Tohoku Electric Power Co, which fell from 119th to 156th and Chugoku Electric Power Co, which dropped from 134th to 178th.
By contrast, Japan’s oil and gas companies performed well. JX Holdings was the shining star, rising from 129th in 2009 to 18th in 2010. Idemitsu Kosan Co Ltd increased its ranking from 144th to 70th. Tokyo Gas Company Ltd upped its place in the list from 108th to 74th. For China, most change was seen within the power sector. The number of Chinese companies in the top 250 was the same in 2010 as in 2009, but the Shenzhen Energy Group, Huadian Power Intl Corp and Shenergy Co. Ltd were displaced by Shanxi Lu’an Environmental Energy Development Co., Shanxi Xishan Coal and Electricity Power Co. and China Longyuan Power Group. In the oil sector, PetroChina moved up from seventh in the rankings to fourth, and CNOOC from 29th to 15th. The biggest mover, however, was China Yangtze Power Co., which jumped from 163rd in 2009 to 112th in 2010.
By contrast, India saw three new companies join the top 250 list—the newlylisted Coal India, oil and gas producer Cairn India Ltd and the IPP company NHPC Ltd. As in Japan, the oil sector also gave India its strongest movers. The Indian Oil Corp Ltd jumped from 78th in 2009 to 42nd in 2010, while the Hindustan Petroleum Corp Ltd rose from 174th to 142nd. [...]
(Please see my post "Platts Top 250 Global Energy Company Rankings 2010." Separately, please watch "Top 250 Energy Company Rankings [2011] analysis: 'Big Oil' dominates, but Asia steals the show," Platts, Nov 2, 2011 and see Platts 2011 rankings for 2010, pdf file. Update: It’s all eyes on China, India and the wider Asia-Pacific region when it comes to rapid financial growth and fast-rising energy companies. Seventy companies from the region were in the spotlight tonight when the 2012 Platts Top 250 Global Energy Company Rankings were unveiled at an awards dinner in Singapore. The 2012 rankings reflect fiscal 2011 financial performance in four key areas: asset value, revenues, profits and return on invested capital/ROIC. ... In an East-West energy showdown, Western majors still dominated. Western integrated oil and gas/IOG and exploration and production/E&P companies took all of the Top 10 spots on the 2012 list, except for one – ninth place – which went to PetroChina Co. Ltd. ExxonMobil reigned supreme in the number one spot of the Top 250 roster for the eighth consecutive year. Anglo-Dutch major Royal Dutch Shell plc moved up from sixth position to second, displacing U.S. major Chevron to third. ConocoPhillips dropped one place from seventh to eighth. Although French major Total slipped from fifth position to seventh, other European majors saw improvements. Like Shell, Norway’s Statoil also ascended, climbing from 11th place to sixth between the 2011 and 2012 rosters. One of the standout movers among the Top 10 and the overall rankings was BP. The U.K. oil major took fourth position on this year’s list, after having plummeted from second place in 2010 to 118th place last year after more than $38 billion in losses from the Macondo oil spill in the Gulf of Mexico. Other majors, including Russian oil and gas giants, held on to their relatively high global rankings, despite slipping in the standings. Gazprom/Open Joint Stock Company – OJSC Gazprom dropped to fifth place this year from third place, while Rosneft dipped from ninth to 10th. OJSC LUKOIL slipped out of the Top 10 this year to 11th place---please see Platts, press release, Oct 23, 2012. -- D.R.)
Wednesday, April 27, 2011
[United States:] Natural Gas Production/Consumption Retrospective 2010
EIA, Today in Energy, Apr 25, 2011
In 2010, the natural gas industry saw an abundance of production and strong consumption. On an average annual basis, marketed production of natural gas grew to 61.8 billion cubic feet (Bcf) per day, an increase of about 4% from 2009, despite relatively low prices. Natural gas consumption in 2010 rose to a record level of 66.1 Bcf per day, up from 62.6 Bcf per day in 2009.
In 2010, the average annual spot natural gas price at the Henry Hub increased 12% to $4.37 per million British thermal units, but remained significantly lower than average annual prices at Henry Hub for any year between 2003 and 2008.
Overall, 2010 may turn out to be an important bellwether for the industry. It represents the natural gas industry's first year without major economic upheaval since shale gas rose to prominence. Key points:
Production:
Consumption:
In 2010, the natural gas industry saw an abundance of production and strong consumption. On an average annual basis, marketed production of natural gas grew to 61.8 billion cubic feet (Bcf) per day, an increase of about 4% from 2009, despite relatively low prices. Natural gas consumption in 2010 rose to a record level of 66.1 Bcf per day, up from 62.6 Bcf per day in 2009.
In 2010, the average annual spot natural gas price at the Henry Hub increased 12% to $4.37 per million British thermal units, but remained significantly lower than average annual prices at Henry Hub for any year between 2003 and 2008.
Overall, 2010 may turn out to be an important bellwether for the industry. It represents the natural gas industry's first year without major economic upheaval since shale gas rose to prominence. Key points:
Production:
- Marketed production of natural gas grew about 4% to 61.8 billion cubic feet (Bcf) per day, and reached its highest recorded level in the lower 48 States. The production gains in the lower 48 States more than offset declines in the Gulf of Mexico, where production continued a long-term decline.
- Net imports of natural gas to the United States in 2010 were at the lowest level since 1994. This was a result of decreases in deliveries of liquefied natural gas from a variety of countries and increases in exports from the United States. Net imports of natural gas represented nearly 11% of total U.S. consumption, the lowest proportion since 1991.
Consumption:
- Consumption of natural gas for electric power generation accounted for about 31% of the total annual natural gas consumed. Natural gas-fired power generation continues to displace coal-fired generation in some regions, when delivered spot prices for natural gas approach those for Appalachian coal (after accounting for the differences in gas and coal plant efficiencies).
- Industrial use of natural gas increased 7% to 18.1 Bcf per day in 2010. Relatively low prices and an improving economy led to increase in production by gas-using industries. [Full text but please see the interactive bar chart of natural gas production, consumption and net imports -- D.R.]
Monday, March 28, 2011
Global Demand Pumps Up Australia's LNG Production
by Sarah-Jane Tasker, The Australian, Mar 9, 2011
AUSTRALIA'S liquefied natural gas production jumped 6.1 per cent [sic] last year, on the back of increasing global demand, which saw the value of exports hit a record $9.5 billion.
LNG production reached 19.8 million tonnes a year, compared with the previous year's 18.6 million tonnes, and the export value rose 24 per cent from $7.6bn, a report by energy economics group EnergyQuest revealed.
"The LNG momentum looks set to continue in 2011," EnergyQuest chief executive Graeme Bethune said.
"So far this year we have already seen another Gladstone LNG project, GLNG, in central Queensland, reaching sanction and the ConocoPhillips/Origin Energy APLNG project, also situated at Gladstone, reaching major milestones.
"Altogether, there are seven Australasian LNG projects aiming for final investment decisions in 2011, with combined capacity of around 40 million tonnes per annum." [...]
The report revealed that Australian natural gas production reached a record 1999 petajoules [some 1.8 tcf] last year [2010], up 5.1 per cent from the previous year's 1902PJ [1.7 tcf -- D.R.].
Australian domestic gas production increased 2.7 per cent to a record 1060PJ [nearly 1 tcf]. Despite the increases in production, the government's carbon tax proposal is set to have an impact on gas-fired electricity generation projects, with the uncertainty stalling the final go-ahead on plans. [...]
The results from last year also saw a turnaround in the nation's oil production, which reach 116 million barrels for the year [This was primarily owing to production from the Pyrenees, Van Gogh and Vincent oil fields, all situated off the northwest Western Australian coast -- D.R]. [Read more]
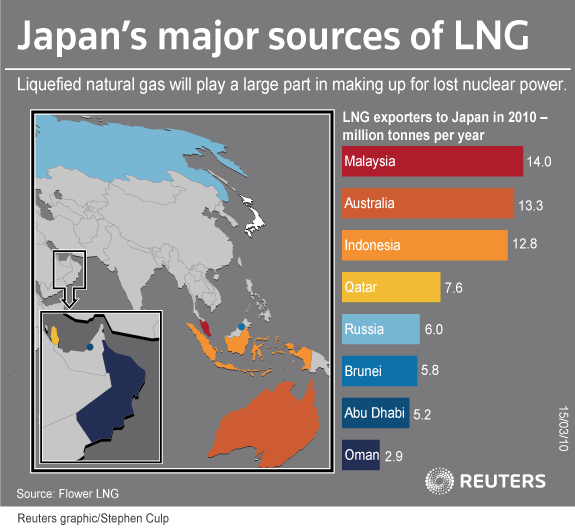
(Please see the latest EnergyQuest report here. Australia is the world's biggest coal exporter, and black coal is Australia's largest export, worth more than $A50 billion in 2008-09/year ending Jun 30. Also, Australia was the world’s fourth largest exporter of liquefied natural gas---LNG---in 2009, after Qatar, Malaysia, and Indonesia. Australia's LNG exports are expected to more than double by 2015-16, with the start-up of several major LNG projects, the Australian Bureau of Agricultural and Resource Economics and Sciences/ABARES, said in a report on Mar 1. Higher demand from consuming countries, especially China and India, in addition to Japan, South Korea, and Southeast Asian countries will also boost Australia's LNG export growth. Australia plans to export more than 60 million mt of LNG by 2020, to become the world's second-biggest LNG supplier behind Qatar. On Mar 29, 2011, Australian coal seam and shale gas explorer Icon Energy signed a binding agreement to supply China's Shantou Sinogas Energy Co., Ltd with 40 million mt of LNG over 20 years from mid-2016. Australia, with its 110 trillion cubic feet---tcf---of proved gas reserves, is the twelfth largest holder of natural gas reserves in the world, as of Jan 1, 2011---please see my post "World's Top 22 Natural Gas Proven Reserve Holders, Jan 1, 2011 -- OGJ," here. Moreover, according to The Oil and Gas Journal, Australia had 110 tcf of proven natural gas reserves as of Jan 1, 2010, triple OGJ's 2009 reserves estimate of 30 tcf. The upgrade is largely a result of increased exploration and development of its unconventional as well as conventional gas sources. It has been reported that unconventional gas deposits, i.e., coal seam and shale gas deposits, have become an increasingly larger component of gas reserves due to technological advances---please see EIA's analysis here. Japan is the primary destination of Australia's LNG. Japan accounted for 65% of Australian LNG exports in 2009. Fitch Ratings says the accident at the Fukushima nuclear power plant could lead to a boost in Japanese demand for Australian thermal coal. An international credit-reporting agency also says increased Japanese demand for LNG could support additional LNG trains at the Browse and Pluto Basins, both offshore from northwest Western Australia. Australia was Japan's second-largest LNG supplier in 2010, after Malaysia---please see bar chart and pie chart below. Australian LNG shipments accounted for 19% of Japan's total LNG imports in 2010. For Japan's LNG imports in 2010, please see my posts here and here -- D.R.)
[Click on bar chart to enlarge]
 Source: Flower LNG via Reuters -- Reuters graphic/Stephen Culp, here. Notes: Obviously, Malaysia also includes East Malaysia/Malaysian Borneo (not indicated above). Also, the Musandam peninsula is an exclave of Oman (not indicated). Furthermore, publication date is incorrect. -- D.R.
 Source: U.S. EIA, Japan Country Analysis Brief, March 2011, here
AUSTRALIA'S liquefied natural gas production jumped 6.1 per cent [sic] last year, on the back of increasing global demand, which saw the value of exports hit a record $9.5 billion.
LNG production reached 19.8 million tonnes a year, compared with the previous year's 18.6 million tonnes, and the export value rose 24 per cent from $7.6bn, a report by energy economics group EnergyQuest revealed.
"The LNG momentum looks set to continue in 2011," EnergyQuest chief executive Graeme Bethune said.
"So far this year we have already seen another Gladstone LNG project, GLNG, in central Queensland, reaching sanction and the ConocoPhillips/Origin Energy APLNG project, also situated at Gladstone, reaching major milestones.
"Altogether, there are seven Australasian LNG projects aiming for final investment decisions in 2011, with combined capacity of around 40 million tonnes per annum." [...]
The report revealed that Australian natural gas production reached a record 1999 petajoules [some 1.8 tcf] last year [2010], up 5.1 per cent from the previous year's 1902PJ [1.7 tcf -- D.R.].
Australian domestic gas production increased 2.7 per cent to a record 1060PJ [nearly 1 tcf]. Despite the increases in production, the government's carbon tax proposal is set to have an impact on gas-fired electricity generation projects, with the uncertainty stalling the final go-ahead on plans. [...]
The results from last year also saw a turnaround in the nation's oil production, which reach 116 million barrels for the year [This was primarily owing to production from the Pyrenees, Van Gogh and Vincent oil fields, all situated off the northwest Western Australian coast -- D.R]. [Read more]
(Please see the latest EnergyQuest report here. Australia is the world's biggest coal exporter, and black coal is Australia's largest export, worth more than $A50 billion in 2008-09/year ending Jun 30. Also, Australia was the world’s fourth largest exporter of liquefied natural gas---LNG---in 2009, after Qatar, Malaysia, and Indonesia. Australia's LNG exports are expected to more than double by 2015-16, with the start-up of several major LNG projects, the Australian Bureau of Agricultural and Resource Economics and Sciences/ABARES, said in a report on Mar 1. Higher demand from consuming countries, especially China and India, in addition to Japan, South Korea, and Southeast Asian countries will also boost Australia's LNG export growth. Australia plans to export more than 60 million mt of LNG by 2020, to become the world's second-biggest LNG supplier behind Qatar. On Mar 29, 2011, Australian coal seam and shale gas explorer Icon Energy signed a binding agreement to supply China's Shantou Sinogas Energy Co., Ltd with 40 million mt of LNG over 20 years from mid-2016. Australia, with its 110 trillion cubic feet---tcf---of proved gas reserves, is the twelfth largest holder of natural gas reserves in the world, as of Jan 1, 2011---please see my post "World's Top 22 Natural Gas Proven Reserve Holders, Jan 1, 2011 -- OGJ," here. Moreover, according to The Oil and Gas Journal, Australia had 110 tcf of proven natural gas reserves as of Jan 1, 2010, triple OGJ's 2009 reserves estimate of 30 tcf. The upgrade is largely a result of increased exploration and development of its unconventional as well as conventional gas sources. It has been reported that unconventional gas deposits, i.e., coal seam and shale gas deposits, have become an increasingly larger component of gas reserves due to technological advances---please see EIA's analysis here. Japan is the primary destination of Australia's LNG. Japan accounted for 65% of Australian LNG exports in 2009. Fitch Ratings says the accident at the Fukushima nuclear power plant could lead to a boost in Japanese demand for Australian thermal coal. An international credit-reporting agency also says increased Japanese demand for LNG could support additional LNG trains at the Browse and Pluto Basins, both offshore from northwest Western Australia. Australia was Japan's second-largest LNG supplier in 2010, after Malaysia---please see bar chart and pie chart below. Australian LNG shipments accounted for 19% of Japan's total LNG imports in 2010. For Japan's LNG imports in 2010, please see my posts here and here -- D.R.)
[Click on bar chart to enlarge]


Sunday, March 20, 2011
Kogas to Send Up to 500,000 Tonnes of LNG to Japan
LNG World News, Mar 18, 2011
South Korea said on Friday Korea Gas Corp (KOGAS), the world’s top corporate buyer of liquefied natural gas (LNG), would supply 400,000-500,000 tonnes of LNG to quake-hit Japan, as requested by Japanese utilities.
South Korea’s economy ministry said in a statement that the state-run entity’s gas supply on a swap basis would be made from late March through April, following a government announcement on the supply plan on Sunday.
Global LNG prices jumped about 10 percent this week after Friday’s earthquake shut nuclear power plants in the world’s third-largest economy [after the U.S. and China], prompting increased demand for LNG.
Analysts reckon the world’s top LNG buyer may import about an extra 1 billion cubic feet per day to make up for the 9 gigawatts of nuclear power lost.
“We will continue to discuss with Japan possible further supplies if needed, while we maintain sufficient inventory levels,” said a government source with direct knowledge of the matter, who declined to be identified. [...]
South Korea’s current LNG inventory stands at 1.5 million tonnes, adding that supply to Japan would come from incoming shipments, not current inventory, the source said.
The ministry also noted South Korea’s emergency oil product and boron supply to Japan, referring to about 4.5 million barrels of shipments by four Korean refiners, as Japanese refiners grapple with the loss of about a third of their 4.5 million barrel-per-day refining capacity [sic].
Japan’s worst quake on record, which sparked a nuclear crisis, has caused the loss of around 9,700 megawatts (MW) of nuclear and 10,831 MW of thermal power generation.
To help stop fission nuclear reactions, South Korea said on Wednesday it would send some of its reserve boron to Japan after a request from Tokyo for the metalloid, which is being mixed with seawater to limit damage to Japan’s crippled nuclear reactors. [Read full]
(Japan is the third largest oil consumer in the world behind the United States and China and the third-largest net importer of crude oil. It is the world's largest importer of both LNG and coal---please see Japan Energy Profile, prepared by the U.S. EIA, here. For information on Japan's nuclear crisis and its impact, please see also my posts under the category/label "Japan." South Korea is the world's second largest importer of LNG. For Asian LNG market, please see my posts here and here. -- D.R.)
South Korea said on Friday Korea Gas Corp (KOGAS), the world’s top corporate buyer of liquefied natural gas (LNG), would supply 400,000-500,000 tonnes of LNG to quake-hit Japan, as requested by Japanese utilities.
South Korea’s economy ministry said in a statement that the state-run entity’s gas supply on a swap basis would be made from late March through April, following a government announcement on the supply plan on Sunday.
Global LNG prices jumped about 10 percent this week after Friday’s earthquake shut nuclear power plants in the world’s third-largest economy [after the U.S. and China], prompting increased demand for LNG.
Analysts reckon the world’s top LNG buyer may import about an extra 1 billion cubic feet per day to make up for the 9 gigawatts of nuclear power lost.
“We will continue to discuss with Japan possible further supplies if needed, while we maintain sufficient inventory levels,” said a government source with direct knowledge of the matter, who declined to be identified. [...]
South Korea’s current LNG inventory stands at 1.5 million tonnes, adding that supply to Japan would come from incoming shipments, not current inventory, the source said.
The ministry also noted South Korea’s emergency oil product and boron supply to Japan, referring to about 4.5 million barrels of shipments by four Korean refiners, as Japanese refiners grapple with the loss of about a third of their 4.5 million barrel-per-day refining capacity [sic].
Japan’s worst quake on record, which sparked a nuclear crisis, has caused the loss of around 9,700 megawatts (MW) of nuclear and 10,831 MW of thermal power generation.
To help stop fission nuclear reactions, South Korea said on Wednesday it would send some of its reserve boron to Japan after a request from Tokyo for the metalloid, which is being mixed with seawater to limit damage to Japan’s crippled nuclear reactors. [Read full]
(Japan is the third largest oil consumer in the world behind the United States and China and the third-largest net importer of crude oil. It is the world's largest importer of both LNG and coal---please see Japan Energy Profile, prepared by the U.S. EIA, here. For information on Japan's nuclear crisis and its impact, please see also my posts under the category/label "Japan." South Korea is the world's second largest importer of LNG. For Asian LNG market, please see my posts here and here. -- D.R.)
Tuesday, March 15, 2011
EU to Сheck Safety of All Its 143 Nuclear Reactors
Kyodo News, Brussels, Mar 15, 2011
The European Union agreed Tuesday to check the safety of all 143 nuclear reactors operating in its 14 member countries [please see my remarks below -- D.R.] in the wake of a nuclear crisis at the quake-hit Fukushima nuclear plant in northeastern Japan.
The European Union made the decision at an emergency meeting of energy ministers of its 27 member countries. Several reactors in the EU region have a structure similar to that of reactors at the Fukushima No. 1 [Daiichi] nuclear power plant, the European Commission said.
As serious accidents hit reactors in Japan, a country deemed to have some of the world's highest safety standards, the European Union is under pressure to review the safety of nuclear power generation, which it has billed as a source of safe and clean energy not emitting global warming gases.
EU Energy Commissioner Günther Oettinger said at a press conference that the nuclear safety checks will address all possible threats, including earthquakes, tsunami and terrorist attacks.
The European Union will also test the durability of a cooling system of those nuclear reactors in view of cooling system problems experienced at the Fukushima nuclear power plant. It will also check a backup power supply system taking lessons from Japan, where electricity shortage is becoming serious with the suspension of nuclear power plant operations.
The commission said Tuesday it is extremely unlikely that Europe will experience an earthquake similar in size to the one that hit northeastern Japan, apparently in an effort to allay fears over its nuclear reactors.
Also at the emergency meeting were officials from nuclear watchdog authorities and power companies from member countries. They will work out details for safety checks in cooperation with the European Union and member state governments. [Full story]
(Also, German Chancellor Angela Merkel said that seven reactors that went into operation before 1980 would be offline for three months while Europe's biggest economy reconsiders its plans to extend the life of its atomic power plants in the wake of events in Japan---please see my posts here and here. One of them, the 840MW Neckarwestheim I reactor, would remain shut down for good. A previous government decided a decade ago to shut all 17 German nuclear reactors by 2021, but Merkel's administration last year moved to extend their lives by an average 12 years. That decision was suspended for three months on Monday. Energy policies in the EU are still driven independently by member nations and vary hugely. For example, France gets about 75% of its energy from nuclear power, while Poland relies mostly on coal and solid fuels. France's 58 nuclear reactors make France the second-biggest user of nuclear power in the world after the United States, where 104 reactors deliver 20% of the country's electricity. In the EU 143 nuclear power plants are in use: Belgium (7), Bulgaria (2), Czech Republic (6), Finland (4), France (58), Germany (17), Hungary (4), Netherlands (1), Romania (2), Slovakia (4), Slovenia (1), Spain (8), Sweden (10), and UK (19). Before the Fukushima disaster, Italy and Poland planned to built nuclear power plants. Switzerland, which is not in the EU, on Monday suspended plans to replace and build new nuclear plants pending a review of the tsunami-stricken reactors in Japan. -- D.R.)
The European Union agreed Tuesday to check the safety of all 143 nuclear reactors operating in its 14 member countries [please see my remarks below -- D.R.] in the wake of a nuclear crisis at the quake-hit Fukushima nuclear plant in northeastern Japan.
The European Union made the decision at an emergency meeting of energy ministers of its 27 member countries. Several reactors in the EU region have a structure similar to that of reactors at the Fukushima No. 1 [Daiichi] nuclear power plant, the European Commission said.
As serious accidents hit reactors in Japan, a country deemed to have some of the world's highest safety standards, the European Union is under pressure to review the safety of nuclear power generation, which it has billed as a source of safe and clean energy not emitting global warming gases.
EU Energy Commissioner Günther Oettinger said at a press conference that the nuclear safety checks will address all possible threats, including earthquakes, tsunami and terrorist attacks.
The European Union will also test the durability of a cooling system of those nuclear reactors in view of cooling system problems experienced at the Fukushima nuclear power plant. It will also check a backup power supply system taking lessons from Japan, where electricity shortage is becoming serious with the suspension of nuclear power plant operations.
The commission said Tuesday it is extremely unlikely that Europe will experience an earthquake similar in size to the one that hit northeastern Japan, apparently in an effort to allay fears over its nuclear reactors.
Also at the emergency meeting were officials from nuclear watchdog authorities and power companies from member countries. They will work out details for safety checks in cooperation with the European Union and member state governments. [Full story]
(Also, German Chancellor Angela Merkel said that seven reactors that went into operation before 1980 would be offline for three months while Europe's biggest economy reconsiders its plans to extend the life of its atomic power plants in the wake of events in Japan---please see my posts here and here. One of them, the 840MW Neckarwestheim I reactor, would remain shut down for good. A previous government decided a decade ago to shut all 17 German nuclear reactors by 2021, but Merkel's administration last year moved to extend their lives by an average 12 years. That decision was suspended for three months on Monday. Energy policies in the EU are still driven independently by member nations and vary hugely. For example, France gets about 75% of its energy from nuclear power, while Poland relies mostly on coal and solid fuels. France's 58 nuclear reactors make France the second-biggest user of nuclear power in the world after the United States, where 104 reactors deliver 20% of the country's electricity. In the EU 143 nuclear power plants are in use: Belgium (7), Bulgaria (2), Czech Republic (6), Finland (4), France (58), Germany (17), Hungary (4), Netherlands (1), Romania (2), Slovakia (4), Slovenia (1), Spain (8), Sweden (10), and UK (19). Before the Fukushima disaster, Italy and Poland planned to built nuclear power plants. Switzerland, which is not in the EU, on Monday suspended plans to replace and build new nuclear plants pending a review of the tsunami-stricken reactors in Japan. -- D.R.)
Saturday, January 22, 2011
Emerging Economies to Lead Energy Growth to 2030 and Renewables to Out-Grow Oil, Says BP Analysis
BP website, Jan 19, 2011
World energy growth over the next twenty years is expected to be dominated by emerging economies such as China, India, Russia and Brazil while improvements in energy efficiency measures are set to accelerate, according to BP’s latest projection of energy trends, the BP Energy Outlook 2030.
BP's 'base case' - or most likely projection - points to primary energy use growing by nearly 40% over the next twenty years, with 93% of the growth coming from non-OECD (Organisation of Economic Co-operation and Development) countries. Non-OECD countries are seen to rapidly increase their share of overall energy demand from just over half currently to two-thirds.
Over the same period, energy intensity, a key measure of energy use per unit of economic output, is set to improve globally led by rapid efficiency gains in the same non-OECD economies, under these projections.
According to the BP Energy Outlook, diversification of energy sources increases and non-fossil fuels (nuclear, hydro and renewables) are together expected to be the biggest source of growth for the first time. Between 2010 to 2030 the contribution to energy growth of renewables (solar, wind, geothermal and biofuels) is seen to increase from 5% to 18%. [According to BP, the rate at which renewables penetrate the global energy market is similar to the emergence of nuclear power in the 1970s and 1980s. -- D.R.]
Natural gas is projected to be the fastest growing fossil fuel, and coal and oil are likely to lose market share as all fossil fuels experience lower growth rates. Fossil fuels’ contribution to primary energy growth is projected to fall from 83% to 64%. [...]
BP’s ‘base case’ projections are that world primary energy demand growth averages 1.7% per year from 2010 to 2030 although growth decelerates slightly beyond 2020. Non-OECD energy consumption will be 68% higher by 2030 averaging 2.6% per year growth, and accounts for 93% of global energy growth. In contrast, OECD growth averages 0.3% per year to 2030; and from 2020 OECD energy consumption per capita is on a declining trend of -0.2% per year.
Transport growth is seen to slow because of a decline in the OECD. The region’s total demand for oil and other liquids peaked in 2005 and will be back at roughly the level of 1990 by 2030. Toward the end of the period, coal demand in China will no longer be rising and China is projected to become the world’s largest oil consumer. [According to the BP Outlook, China is the largest source of oil consumption growth, with consumption forecast to grow by 8 million barrels a day to reach 17.5 million barrels a day by 2030, overtaking the United States to become the world's largest oil consumer -- D.R.]
OPEC’s share of global oil production is set to increase to 46%, a position not seen since 1977. At the same time, oil - and gas - import dependency in the US is likely to fall to levels not seen since the 1990s, because of improved fuel efficiency and the increased share of biofuels. Global consumption growth is also impacted by higher oil prices in recent years and a gradual reduction of subsidies in oil-importing countries.
The fuel mix changes over time, reflecting long asset lifetimes. Oil, excluding bio-fuels, will grow relatively slowly at 0.6% per year; natural gas is the fastest growing fossil fuel with more than three times the projected growth rate of oil at 2.1% per year. Coal will increase by 1.2% per year and by 2030 it is likely to provide virtually as much energy as oil excluding biofuels. The strong carbon policy drive in OECD countries risks being more than offset by growth in emerging economies. [Among non-fossil fuels, renewables are expected to grow at 8.2% per year from 2010 to 2030.]
Wind, solar, bio-fuels and other renewables continue to grow strongly, increasing their share in primary energy from less than 2% now to more than 6% projected by 2030. Biofuels will provide 9% of transport fuels and nuclear and hydropower will grow steadily and gain market share in total energy consumption.
“The slowing of growth in total energy in transport is related to higher oil prices and improving fuel economy, vehicle saturation in mature economies, and expected increases in taxation and subsidy reduction in developing economies,” said Rühl. “In percentage terms, oil demand is reduced the most in the power sector (-30%) because this is the easiest oil to displace with gas or renewables and is the sector most likely to employ carbon pricing.” [...]
Global liquids demand is forecast to reach 102.4 million barrels per day (mmbpd) in 2030. The net growth of 16.5 mmbpd over the next 20 years comes exclusively from the emerging economies of the non-OECD. “Non-OECD Asia will account for nearly two-thirds of non-OECD consumption growth over the next 20 years and more than three-quarters of the net global increase, rising by nearly 13 million barrels a day,” said Rühl.
The largest increments of new supply will come from OPEC – conventional crude in Saudi Arabia and Iraq, as well as OPEC natural gas liquids (NGLs) which are not subject to OPEC quotas.”
Non-OPEC liquids are likely to rise modestly, driven by a large increase in biofuels, along with smaller increments from Canadian oil sands, deepwater Brazil, and the FSU which offset continued declines in mature provinces. [...]
According to the Energy Outlook’s projections, oil continues to suffer a long run decline in market share, while gas steadily gains share. Coal’s recent gains in market share, on the back of rapid industrialisation in China and India in particular, are reversed by 2030, with all three fossil fuels converging on market shares around 27%. [...]
Biofuels production is expected to reach 6.7 mmbpd by 2030 from 1.8 mmbpd in 2010 and will contribute 125% of net non-OPEC supply growth over the next 20 years. Continued policy support, high oil prices, and continued technological innovations all contribute to the rapid expansion.
The US and Brazil will continue to dominate biofuel production with 76% of total output in 2010 but falling to 68% in 2030 as output from Asia-Pacific begins to rise. [Read More]
(The BP Energy Outlook 2030 is the first of BP’s forward-looking analyses to be published, after 60 years of producing definitive historical data in the BP Statistical Review of World Energy. The Energy Outlook has been used only internally so far. Prof. Christof Rühl is Chief Economist of BP plc. The BP Energy Outlook 2030 is available in pdf format here -- D.R.)
World energy growth over the next twenty years is expected to be dominated by emerging economies such as China, India, Russia and Brazil while improvements in energy efficiency measures are set to accelerate, according to BP’s latest projection of energy trends, the BP Energy Outlook 2030.
BP's 'base case' - or most likely projection - points to primary energy use growing by nearly 40% over the next twenty years, with 93% of the growth coming from non-OECD (Organisation of Economic Co-operation and Development) countries. Non-OECD countries are seen to rapidly increase their share of overall energy demand from just over half currently to two-thirds.
Over the same period, energy intensity, a key measure of energy use per unit of economic output, is set to improve globally led by rapid efficiency gains in the same non-OECD economies, under these projections.
According to the BP Energy Outlook, diversification of energy sources increases and non-fossil fuels (nuclear, hydro and renewables) are together expected to be the biggest source of growth for the first time. Between 2010 to 2030 the contribution to energy growth of renewables (solar, wind, geothermal and biofuels) is seen to increase from 5% to 18%. [According to BP, the rate at which renewables penetrate the global energy market is similar to the emergence of nuclear power in the 1970s and 1980s. -- D.R.]
Natural gas is projected to be the fastest growing fossil fuel, and coal and oil are likely to lose market share as all fossil fuels experience lower growth rates. Fossil fuels’ contribution to primary energy growth is projected to fall from 83% to 64%. [...]
BP’s ‘base case’ projections are that world primary energy demand growth averages 1.7% per year from 2010 to 2030 although growth decelerates slightly beyond 2020. Non-OECD energy consumption will be 68% higher by 2030 averaging 2.6% per year growth, and accounts for 93% of global energy growth. In contrast, OECD growth averages 0.3% per year to 2030; and from 2020 OECD energy consumption per capita is on a declining trend of -0.2% per year.
Transport growth is seen to slow because of a decline in the OECD. The region’s total demand for oil and other liquids peaked in 2005 and will be back at roughly the level of 1990 by 2030. Toward the end of the period, coal demand in China will no longer be rising and China is projected to become the world’s largest oil consumer. [According to the BP Outlook, China is the largest source of oil consumption growth, with consumption forecast to grow by 8 million barrels a day to reach 17.5 million barrels a day by 2030, overtaking the United States to become the world's largest oil consumer -- D.R.]
OPEC’s share of global oil production is set to increase to 46%, a position not seen since 1977. At the same time, oil - and gas - import dependency in the US is likely to fall to levels not seen since the 1990s, because of improved fuel efficiency and the increased share of biofuels. Global consumption growth is also impacted by higher oil prices in recent years and a gradual reduction of subsidies in oil-importing countries.
The fuel mix changes over time, reflecting long asset lifetimes. Oil, excluding bio-fuels, will grow relatively slowly at 0.6% per year; natural gas is the fastest growing fossil fuel with more than three times the projected growth rate of oil at 2.1% per year. Coal will increase by 1.2% per year and by 2030 it is likely to provide virtually as much energy as oil excluding biofuels. The strong carbon policy drive in OECD countries risks being more than offset by growth in emerging economies. [Among non-fossil fuels, renewables are expected to grow at 8.2% per year from 2010 to 2030.]
Wind, solar, bio-fuels and other renewables continue to grow strongly, increasing their share in primary energy from less than 2% now to more than 6% projected by 2030. Biofuels will provide 9% of transport fuels and nuclear and hydropower will grow steadily and gain market share in total energy consumption.
“The slowing of growth in total energy in transport is related to higher oil prices and improving fuel economy, vehicle saturation in mature economies, and expected increases in taxation and subsidy reduction in developing economies,” said Rühl. “In percentage terms, oil demand is reduced the most in the power sector (-30%) because this is the easiest oil to displace with gas or renewables and is the sector most likely to employ carbon pricing.” [...]
Global liquids demand is forecast to reach 102.4 million barrels per day (mmbpd) in 2030. The net growth of 16.5 mmbpd over the next 20 years comes exclusively from the emerging economies of the non-OECD. “Non-OECD Asia will account for nearly two-thirds of non-OECD consumption growth over the next 20 years and more than three-quarters of the net global increase, rising by nearly 13 million barrels a day,” said Rühl.
The largest increments of new supply will come from OPEC – conventional crude in Saudi Arabia and Iraq, as well as OPEC natural gas liquids (NGLs) which are not subject to OPEC quotas.”
Non-OPEC liquids are likely to rise modestly, driven by a large increase in biofuels, along with smaller increments from Canadian oil sands, deepwater Brazil, and the FSU which offset continued declines in mature provinces. [...]
According to the Energy Outlook’s projections, oil continues to suffer a long run decline in market share, while gas steadily gains share. Coal’s recent gains in market share, on the back of rapid industrialisation in China and India in particular, are reversed by 2030, with all three fossil fuels converging on market shares around 27%. [...]
Biofuels production is expected to reach 6.7 mmbpd by 2030 from 1.8 mmbpd in 2010 and will contribute 125% of net non-OPEC supply growth over the next 20 years. Continued policy support, high oil prices, and continued technological innovations all contribute to the rapid expansion.
The US and Brazil will continue to dominate biofuel production with 76% of total output in 2010 but falling to 68% in 2030 as output from Asia-Pacific begins to rise. [Read More]
(The BP Energy Outlook 2030 is the first of BP’s forward-looking analyses to be published, after 60 years of producing definitive historical data in the BP Statistical Review of World Energy. The Energy Outlook has been used only internally so far. Prof. Christof Rühl is Chief Economist of BP plc. The BP Energy Outlook 2030 is available in pdf format here -- D.R.)
Subscribe to:
Posts (Atom)